ChartsGraphsDiagrams.com Making information easier to see
Charts, Graphs, & Diagrams
Collections of charts/graphs/diagrams on health, climate, sports, and other topics.
as well as some discussion about the value, creation, and usage of charts. A site rebuild is underway.
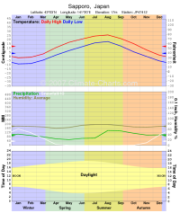
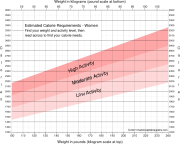
Health Charts Growth, calorie requirements, wind chill, heat index, and more.
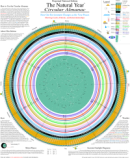
The Natural Year Weather data, sunrise and set, moonrise, set and phase, tides, stars, and planet motions are vividly displayed. Link goes to another site.
Suggest an idea for a chart, and if I use it I'll give you credit.
About this site
This is sort of an 'umbrella' site, as I'm pulling together some material that has been
spread over several different sites.
It all reflects my long-term interest in data visualization.
We are adding to our collection of charts frequently. Check back soon for more charts,
or suggest a chart.
Charts vs Graphs vs Diagrams
I'm not aware of a good way to differentiate these terms, and I'm not going to try.
They all embody the idea of adding visual or spatial elements that improve our ability to understand something.
'Chart' is often used to describe simple representations of two-variable date,
as in bar charts or pie charts.
Often chart data could be presented in a table, which is fine.
However, such a table is often called a chart, which is erroneous and confusing.
'Chart' is also used to refer to complex and data-dense displays such as maps.
'Graph' tends to be used more in more mathematical settings, with x and y axes, but there are many exceptions.
'Diagram' usually implies a symbolic and non-numeric representation of something, but again, there are exceptions.
About Me
I'm Joe Casey. The charts are a reflection of my long-term interest in data visualization.
It is often easier to see patterns and highlights when the data is presented in a chart.
See Chartmaking for a discussion of how I make charts.
Please email me if you have any questions,
comments or suggestions, or if you are interested in having some custom charts created.
Become Famous! Suggest an idea for a chart, and if I use it I'll give you credit.
Privacy, Security, etc.
You don't have to register to use this site. We don't gather any information about you. If you contact us via email we will keep your email address private.
We don't set any cookies or gather any information about your visit activities or history.
The Google AdSense ads on this site may serve cookies and/or web beacons. Our site has no access to these or control over them.
Google's use of the DART cookie enables it to serve ads based on your visit to this site and other sites on the Internet.
You may opt out of the use of the DART cookie by visiting the
Google ad and content network privacy policy.
We have no popups, popunders, spyware, etc. Just some useful charts.
ChartsGraphsDiagrams.com Making information easier to see