Charts, Graphs, & Diagrams > Health Charts > Weight Chart for Girls, Birth to 36 Months
Weight Chart for Girls, Birth to 36 Months
Find your child's growth percentile based on age and weight.
- Description and comments
- Source: CDC National Center for Health Statistics
- Boys version of this chart
- PDF version
Description and comments
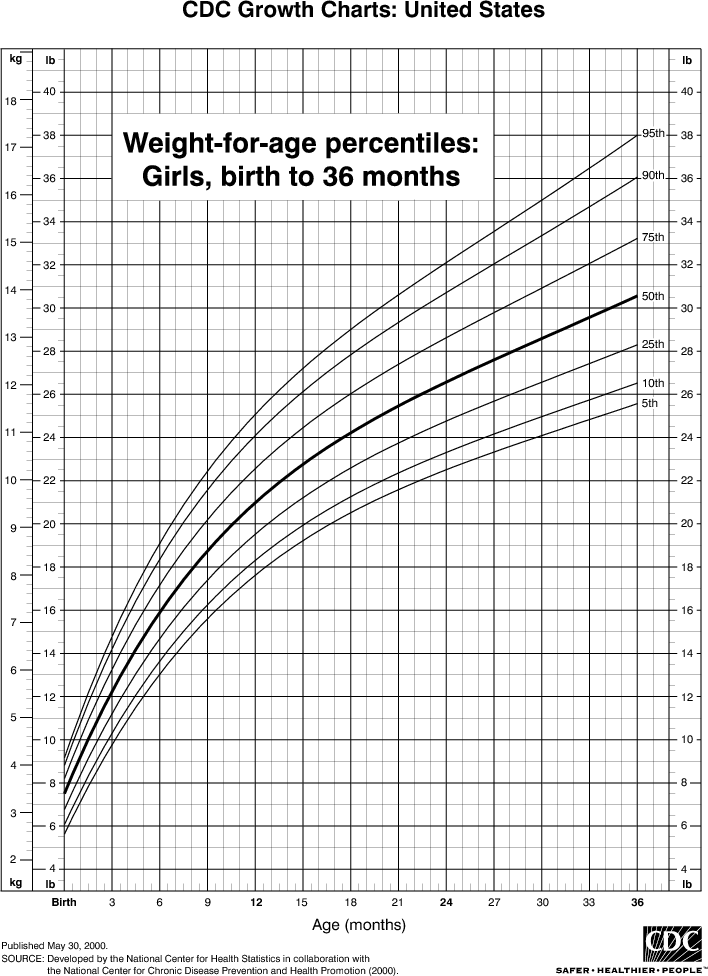
This chart shows the percentiles of weight for girls from birth to 36 months.
How to read the percentile chart
The curved lines show weight percentiles. For example, the top curved line shows the 95% percentile, which means that 95% of children are at or under that weight.
The bottom of the chart shows ages, from birth to 36 months. The left and right sides of the chart show weights.
The chart shows that at birth 95% of girls are less than 9 pounds (about 4.2 kilograms) and 5% are less than 5.5 pounds (2.6 kg). At 36 months (3 years) 95% of girls are less than 39.5 pounds (about 17.6 kg) and 5% are less than 25.5 pounds (11.6 kg).
Find your child's weight on either side, and read horizontally across until you reach the vertical line for your child's age. Then see where that point is among the percentile lines.
For example, a girl 26 pounds (11.8 kg) and 18 months old is just at the 75% percentile.
Consult your physician if you are concerned about your child's weight.
Related Charts:
- Girls weight, 2 to 20 years
- Girls combined height & weight, birth to 36 months
- Boys weight, birth to 36 months
Also see the CDC NCHS Frequently Asked Questions page for growth charts.
About this chart
The chart is taken directly from the Centers for Disease Control National Center for Health Statistics. We converted it from a PDF file into a web graphic. You can view and print the PDF version here if you would like to record your child's weight.
Charts, Graphs, & Diagrams > Health Charts > Weight Chart for Girls, Birth to 36 Months
© 2006 ChartsGraphsDiagrams.com