Charts, Graphs, & Diagrams > Health Charts > Body Mass Index (BMI) Percentiles for Boys, 2 to 20 Years
Body Mass Index (BMI) Percentiles for Boys, 2 to 20 Years
This is easy to use - no data input required. Find your child's BMI percentile in the chart based on height and weight.
- Description and comments
- Source: CDC National Center for Health Statistics
- Girls version of this chart
- PDF version
Description and comments
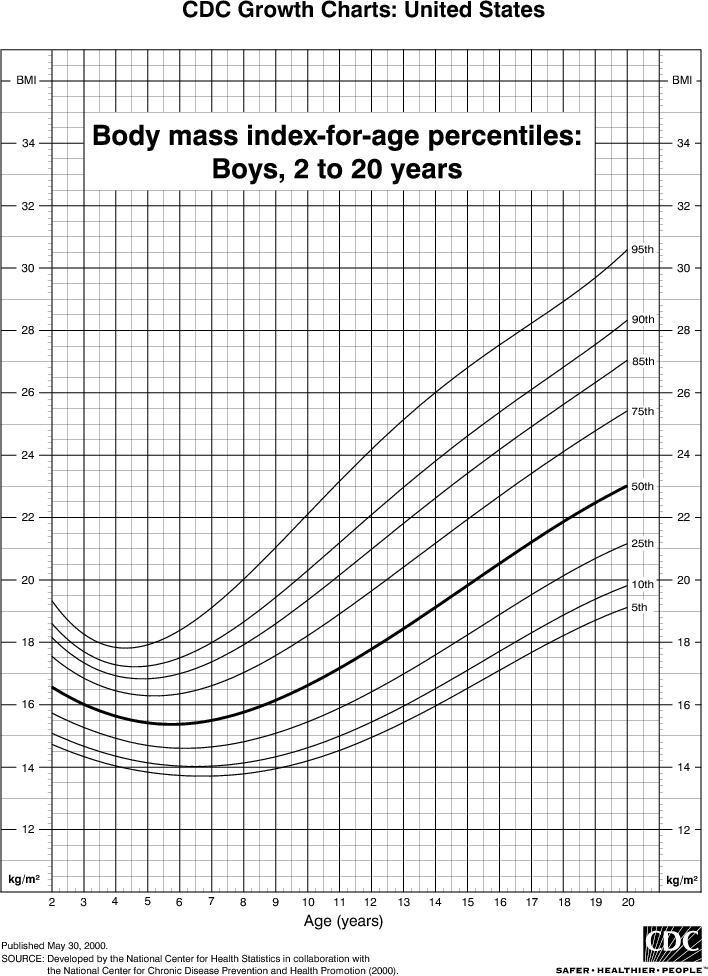
This chart shows the Body Mass Index (BMI) percentiles for boys from 2 to 20 years old.
How to read the percentile chart
The curved lines show BMI percentiles. For example, the top curved line shows the 95% percentile, which means that 95% of children are at or under that value.
The bottom of the chart shows ages, from 2 to 20 years. The left and right sides of the chart show BMI values.
The chart shows that at age 2 years 95% of boys have a BMI less than 19.4 and 5% have one less than 14.6. At 20 years 95% of boys have a BMI less than 30.6, and 5% have one less than 19.
How to find your child's BMI percentile
First, find your child's BMI in BMI for Children.
Then on this page, find your child's BMI on either side of the chart, and read horizontally across until you reach the vertical line for your child's age. Then see where that point is among the percentile lines.
For example, a boy with a BMI of 18 at age 12 is just above the 50% percentile.
Childrens weight status
The BMI for children is calculated the same way as for adults. However, it is interpreted differently. Here are the CDC weight status classifications for use with the above table:
| Percentile | Weight Status |
|---|---|
| 95th-100th | Overweight |
| 85th-95th | At Risk of Overweight |
| 5th-85th | Normal |
| 5th or less | Underweight |
Consult your physician if you are concerned about your child's growth.
Related Charts:
- BMI for Children.
- Boys combined height & weight, 2 to 20 years
- Girls BMI percentiles, 2 to 20 years
- BMI for adults
Also see the CDC NCHS Frequently Asked Questions page for growth charts.
About this chart
The chart is taken directly from the Centers for Disease Control National Center for Health Statistics. We converted it from a PDF file into a web graphic. You can view and print the PDF version here if you would like to record your child's growth.
Charts, Graphs, & Diagrams > Health Charts > Body Mass Index (BMI) Percentiles for Boys, 2 to 20 Years
© 2006 ChartsGraphsDiagrams.com